Ever wondered why you’re not able to load a website or connect to a particular server? Using traceroutes can potentially shed some light on this particular problem. In this article, I will be showing how to perform a traceroute on both Windows and Macintosh machines.
A brief, very high-level explanation of what’s going on here:
When you attempt to connect to a remote computer (like when you load a website in your browser), you are not able to connect directly to the remote server. Instead, you “hop” from one server to another, until you (we’re hoping) finally reach your destination. Sometimes, however, one of the servers that you’re hopping through might be inaccessible or is for some other unknown reason not forwarding your requests properly.
Traceroute is designed to determine the exact route through these servers that your packets are travelling, and if they stop prematurely, it will give you a great indication of the failure’s point.
Using traceroutes on Windows
In order to run a traceroute, we’re going to need to first open our command line terminal. To do this, you simply perform the following actions:
Opening Windows terminal:
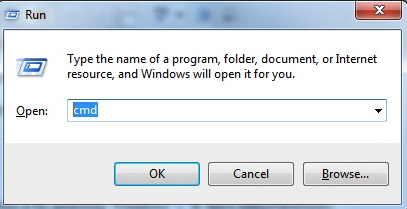
- Press Windows Key + R
- Type in: cmd
- Press: Enter
After completing the first two steps, you should see this box:
Once you press Enter, you should now see a black box, like this:
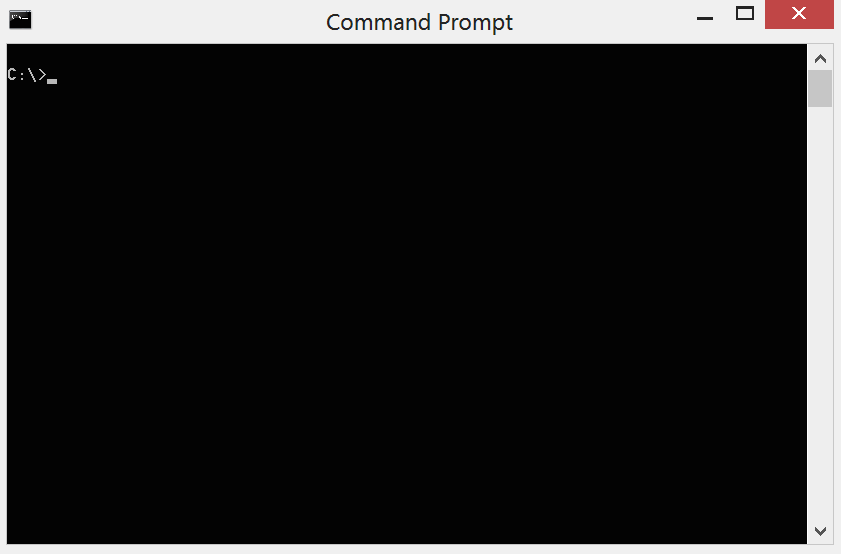
To execute the actual traceroute, we will need to type the following:
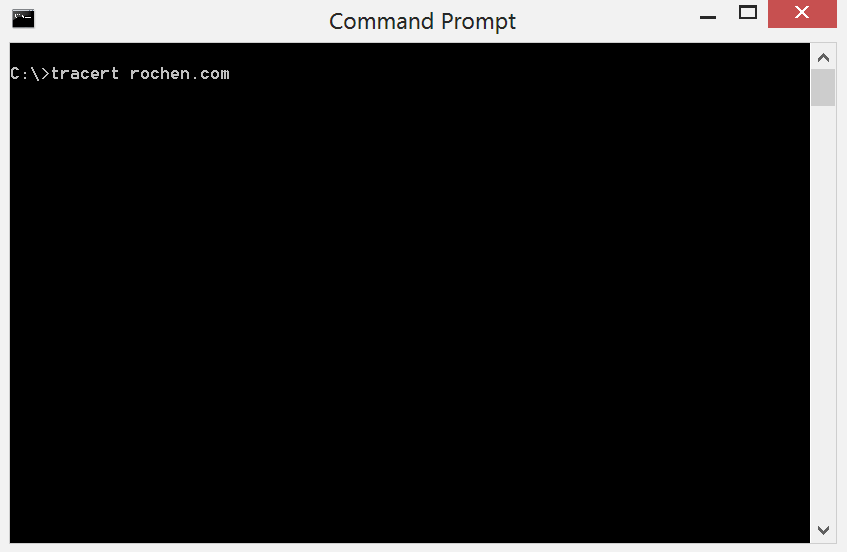
tracert ipAddressORdomainName
If I wanted to trace the route between my computer and http://rochen.com/, for example, I would execute the following:
I will go over what the output of this command actually means later in this article, but for now, let’s learn how to do it on a Macintosh.
Using traceroutes on macOS
In order to successfully perform a traceroute on a macOS computer, we will need to first open our terminal:
- Click the Spotlight icon in the top-right of your desktop (magnifying glass)
- Type: terminal
- Press: Enter
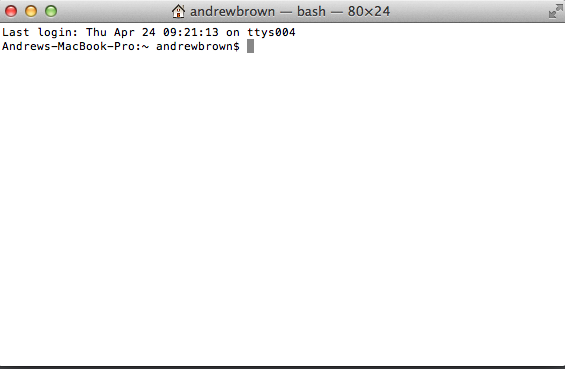
If you completed the first two steps, you should now see this in the upper right-hand corner of your screen:

After pressing Enter you should see the following white box:
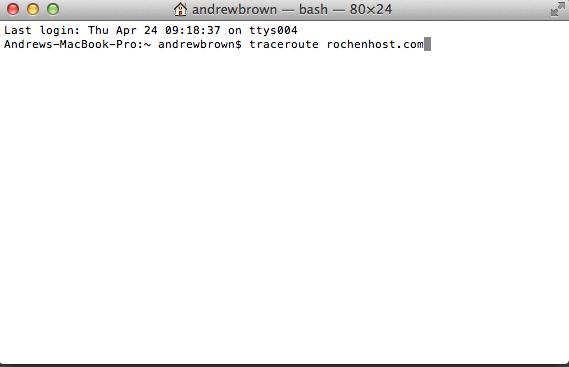
The command for macOS is slightly different, however. We will want to type the following into our newly-spawned terminal:
trouceroute ipaddressORdomainname
If I needed to trace the route between http://rochen.com/, just like above, I would execute the following:
What a successful traceroute looks like
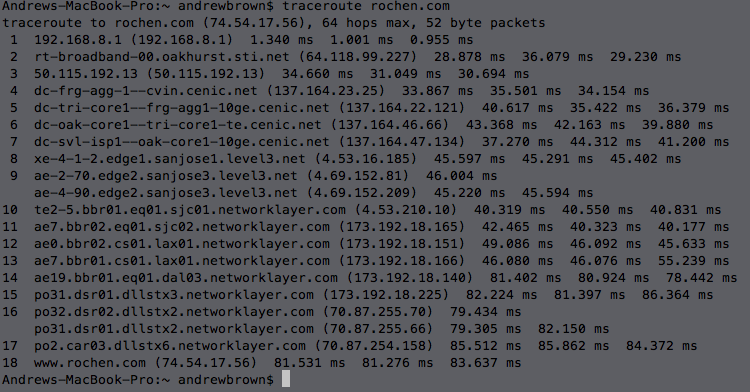
Here is what you should be seeing after running your traceroute, provided all is well:
What does the data mean?
As can be seen from the screenshot above, the data are presented in the following format:
HopNumber – DomainName(If Applicable) – IPAddress – Latency * 3
HopNumber
This is the current number of hops you’ve made through servers. The more hops, the longer it is going to take to reach your destination.
Domain Name
This is the domain name of the remote server that we’re passing your packets through. If this server does not have a domain name, an IP address will be displayed instead.
IP Address
Simply, it is the IP address of the remote server.
Latency
This is the time it takes for your packet to reach the remote machine and successfully receive a response from it. This value is measured in milliseconds, so it can be important to remember that 1,000 milliseconds is equal to 1 second. If you are on any kind of broadband connection and you see the milliseconds climb above 300-400 on any particular hop, this could be indicative of a problem on the remote machine in your route.
The final hop should be the domain name or IP address that you tracerouted. If there is a problem in the route, you will see something like this instead:
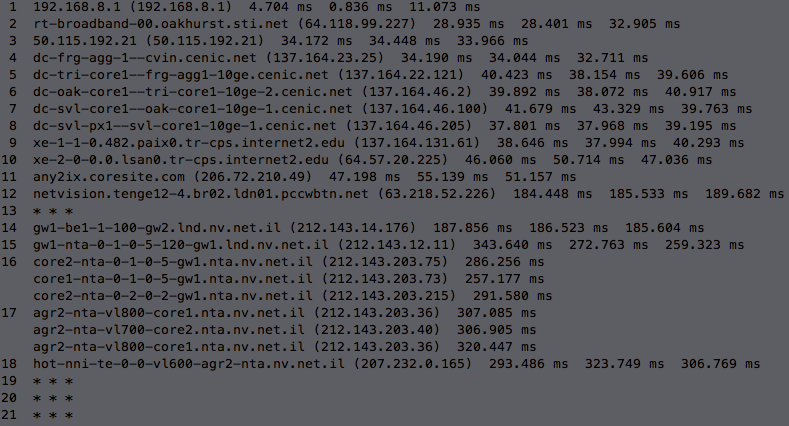
As can be seen from the output of the failed trace, the latency begins increasing as I pass through the “netvision.tenge12-4.br02.ldn01.pccwbtn.net” machine, and it gets progressively worse until culiminating in a complete timeout/failure after passing through hot-nni-te-0-0-vl600-agr2-nta.nv.net.il, which is represented by the triple-asterisk (* * *).
From that output, we know that the last server that was able to respond to me was hot-nni-te-0-0-vl600-agr2-nta.nv.net.il. For some reason, this server was not able to push my request to the next remote machine. For that information, I would likely need to contact the server administrators at hot-nni-te-0-0-vl600-agr2-nta.nv.net.il or my own Internet Service Provider to see if they can offer any additional insight.
Using traceroutes can be very helpful, especially if you make it into Rochen’s network, but then the route fails for some reason. In situations like that, we should be able to analyze logs and configurations to determine the cause of failure.
This concludes the using traceroutes article; it is my hope that you are now able to perform traceroute in addition to accurately analyzing its output.
If you need any assistance, please open a technical support ticket.