A great new feature of CloudLinux+ is PHP X-Ray integration with cPanel, which provides quick and easy troubleshooting of slow sites. With this tool, you can now dig into slow site performance straight from the cPanel interface.
Using PHP X-Ray Integration
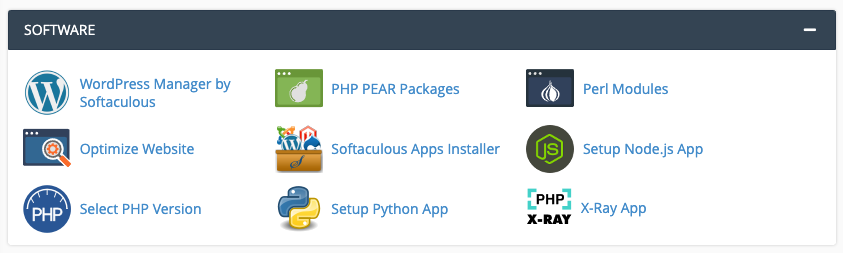
To use PHP X-ray integration, log in to cPanel and click the X-Ray App icon in the Software section.
Start your trace
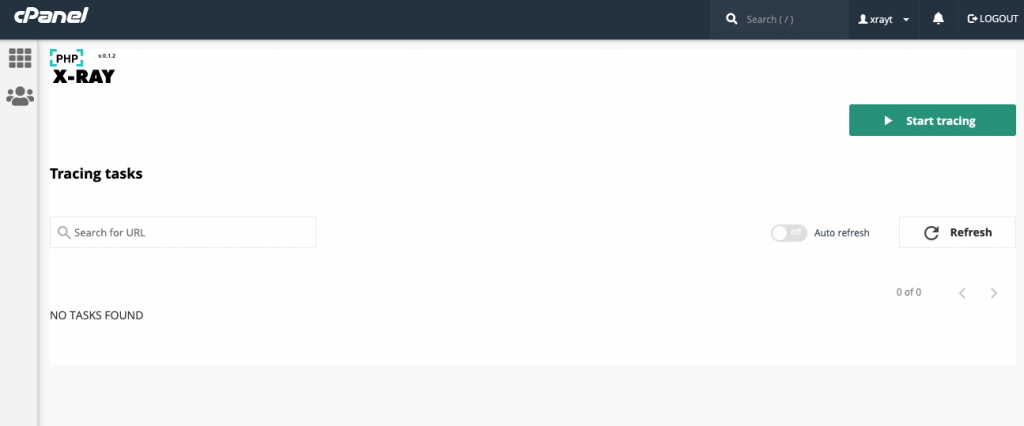
Now you’re on the main PHP X-Ray page, click Start Tracing. Select the desired site and additional parameters for the trace from the drop-down.
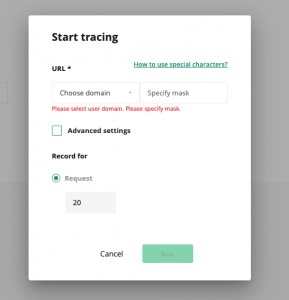
Select your domain in the drop-down and enter a ‘mask’ to define the page URLs to check. If you are troubleshooting your homepage, enter “/” without quotes as the mask and click Run.
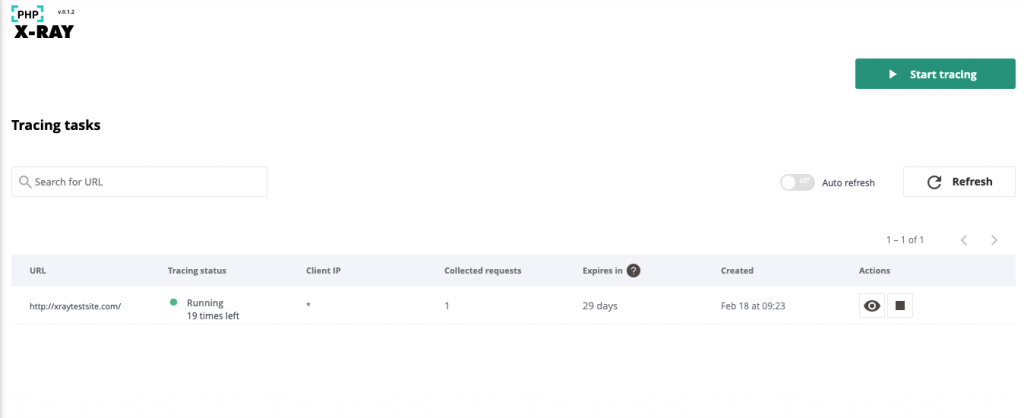
You will see your new task running on the PHP X-Ray dashboard:

Analyze performance
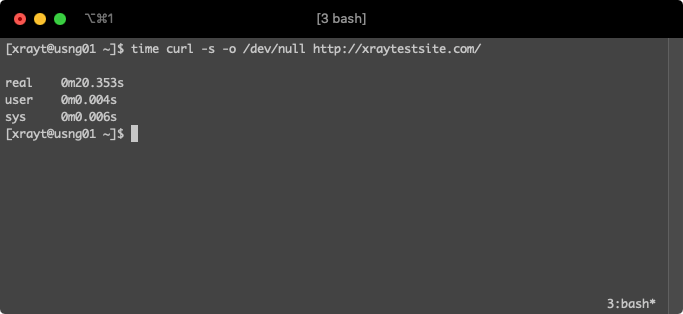
After you’ve completed the above steps, go to your website. You can enter the URL in your browser or use a command line tool such as cURL. The PHP X-Ray tool will begin analyzing your site performance.
On the PHP X-Ray page in cPanel, click the Refresh button. You should see at least one collected request.
Now click the view button under Actions to see the trace results.
When you see the list of requests that have been caught, click the one you want to review.

PHP X-Ray results checklist
First, check the Top Issues section.
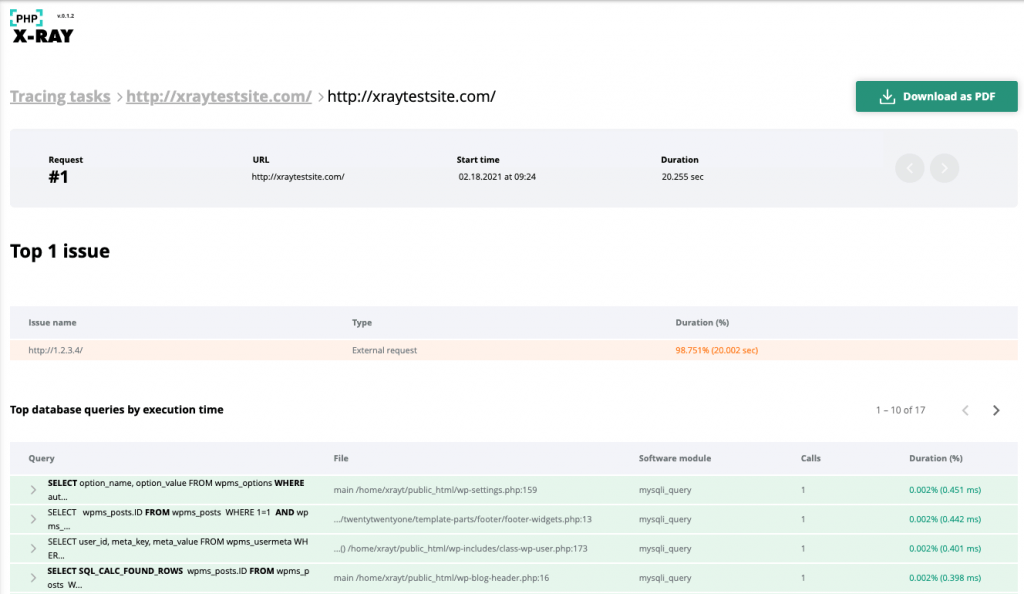
Above, you can see that there is one external request to http://1.2.3.4/, generating 98.751% of the page’s loading time and is the cause of the poor performance in this case.
To investigate further, scroll to the summary of External requests.
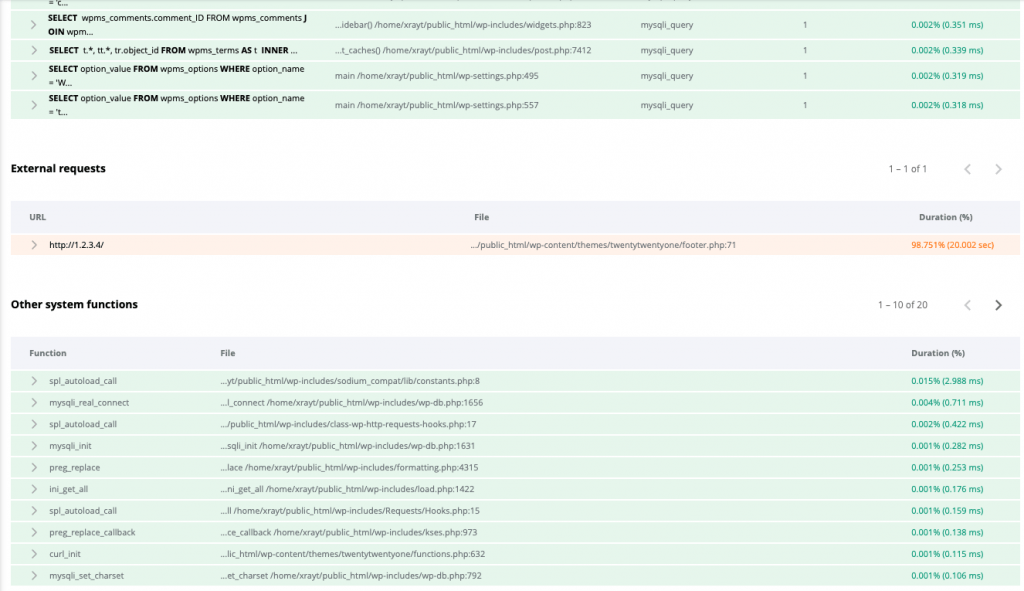
Under the File column, it appears that /home/xrayt/public_html/wp-content/themes/twentytwentyone/footer.php may be responsible.
Click the drop-down button to the left to provide extended info.

Note that /home/xrayt/public_html/wp-content/themes/twentytwentyone/functions.php called check_external_rss(), ultimately generating the slow outbound HTTP request.
In the functions.php file, online 637, you can see the exact point of origin for the external HTTP call.

Because this function was added to the WordPress default theme for testing, we can remove the section beginning at function check_external_rss() to the end of the file, to resolve the slow loading time.
In real-world scenarios, it’s common to see theme or plugin license checks to remote servers cause this issue. This is especially true if the third-party licensing server is unreachable. Depending on the script in use, plugin or theme update checks can also cause similar issues.
When the problem is unrelated to an external request, other sections of the PHP X-Ray report will yield more helpful insight, particularly the top database queries by execution time and the list of system function calls.
If you have questions about using the PHP X-Ray tool in cPanel, you can open a support ticket with us, and, as always, we’ll be happy to assist!